Article
Busting the Value Trap: How B2B Companies Can Increase Sales


Balancing Customer Satisfaction and Sales
Customer-facing businesses are constantly looking to make customers happy. Consumers are well aware of this because they’re bombarded with advertisements and other marketing efforts claiming how companies strive to satisfy them.
There is one issue less well-known to the average consumer—but readily apparent to CEOs who must operate at the 100,000-foot level: for business-to-business (B2B) companies, increasing sales is just as important as satisfying customers.
The B2B Buyer vs. the B2C Buyer
B2B customers are different than the targets of business-to-customer (B2C) organizations. B2C consumers typically differ in the following ways:
- They buy in smaller amounts
- They buy more often
- They make purchases at the individual level
- And they tend to be a bit more emotional in their buying behavior
B2B customers, on the other hand, are:
- More rational than emotional
- More driven by value and price
- More likely to engage several people in the purchase and consumption decision
- And beholden to longer decision and consumption cycles
Because B2B buyers are perceived to be driven more by price and value as a product and service attribute, their vendors often find themselves in the “value trap.” But as shown in a recent analysis by BrandExtract research partners, the Customer-Based Execution & Strategy (CUBES®), the value trap can be avoided by focusing on customer satisfaction over other more prominent sales metrics.
The B2B Value Trap
The B2B value trap is based on two fallacies.
- Product-features fallacy - To improve sales, B2B companies become focused on technology and ensuring their product has more and better features than their competitors’ products. Investments to add or improve features become a key imperative. However, adding product features not only makes the offering more complex, it also increases costs.
- Pricing fallacy - To improve sales, companies believe they must be price competitive. That is, they try to price their products equal to or lower than competitors. After all, B2B customers are perceived to be more rational, have contracts and purchasing departments, and are well informed.
But therein lies the trap: As companies on one hand increase their costs by adding features and on the other hand try to compete on price, they find themselves in a self-defeating spiral of growing their customer base while earning lower revenues.
The result is a long-term decline in company value. The value trap also makes company executives progressively more reactive—customers demand more features and become accustomed to lower prices, and they can do so with increasing force during recessionary environments.
Busting the B2B Value Trap with Satisfaction
How do companies find their way out of the value trap? Results from the CUBES® research project indicate B2B companies must focus on overall customer satisfaction, not just on price and product features.
Overall customer satisfaction encompasses the entire supplier-buyer experience. Many companies conduct customer satisfaction surveys and try to document their customers’ overall satisfaction levels. However, they struggle to answer three basic questions:
- Is overall customer satisfaction tangibly related to sales?
- If yes, what is the nature of the relationship between overall customer satisfaction and sales
- What does this mean for a particular B2B firm?
A large body of research shows customer satisfaction matters. Unfortunately, most of the conclusions are based on B2C interactions, and the available studies of B2B customer satisfaction are based on single-company cases. So B2B executives are stuck trying to apply non-representative findings to their own firms.
To be confident in the relationship between overall customer satisfaction and sales in a B2B context, executives need quantitative information based on a reliable and sufficiently large sample of B2B firms.
CUBES®: Customer-Based Execution & Strategy
Our partnership with the CUBES® research initiative is designed to develop a B2B customer-based perspective that enables executives to design and execute strategy. The goals of the project are to:
- Understand the extent to which overall customer-satisfaction—a key customer metric—is associated with executive-relevant outcomes like price-power, customer loyalty, willingness to recommend, and financial performance.
- Identify key strategic areas (e.g., bidding, safety, pricing) that can be leveraged to improve overall satisfaction.
- Determine specific execution levers to improve performance in key strategic areas.
- Provide a framework for executives to use a customer-based approach to crafting and executing strategy.
We use a multi-step approach to answer the key question: How, if at all, is overall customer satisfaction associated with non-financial and financial outcomes in a B2B context?
Step 1: Literature review
A rich body of academic papers shows customer satisfaction can affect many company outcomes. However, the vast majority of papers address only B2C interactions. When scholars have examined B2B companies, they have examined single companies. And while it is easier to work with such case studies, it does not provide the level of descriptive confidence needed to understand the dynamics of the larger B2B marketplace.
Existing studies are also narrow in scope. Most examine a limited set of outcomes, focusing only on customer loyalty metrics and not aligning them with financial results. The CUBES project, therefore, examines a broader set of outcomes, including:
- Customer loyalty metrics: Whether a company will use a supplier for the next job, invite a bid, recommend the supplier, and pass along positive or negative word-of-mouth.
- Top-line financial performance: Sales and revenue.
- Bottom-line financial performance: Gross margins and earnings before interest, taxes, depreciation, and amortization (EBITDA).
- Stock-market metrics: Return on assets and Tobin’s Q .
Details of the CUBES® study can be found here.
Step 2: Data Collection
In November 2016, a national panel of B2B managers participated in the baseline CUBES® survey. The researchers measured overall customer satisfaction using a seven-point Likert scale. The scale is balanced with three categories indicating dissatisfaction, one showing indifference between satisfaction and dissatisfaction, and three categories indicating satisfaction. Each category has a numeric value and a verbal descriptor.
If the supplier rated by the respondent represented a publicly-traded company, researchers matched the supplier name to financial information. This is the source of all sales, revenue, and margin data used in the study, and such objective sales metrics made the results far more robust than subjective or self-reported sales measures.
Step 3: Econometric Estimation
The team statistically merged the overall customer satisfaction survey with the financial data, and the results were analyzed using an econometric model that statistically isolates the unique association of overall customer satisfaction with each metric. The econometric model controls for the confounding effect of non-focal factors associated with the B2B firm (e.g., liquidity), industry (e.g., industry concentration), and respondent. This procedure provides a representative picture of the association of overall customer satisfaction with the different outcomes.
Overall Customer Satisfaction and Sales
Using the described methodology, CUBES® was able to answer three critical questions.
1. Is there a relationship between overall customer satisfaction and sales in a B2B context?
On average, each unit increase in overall customer satisfaction is associated with $10.3 million increase in annualized sales. However, this relationship is not as simple as previously believed.
2. What is the nature of the relationship between overall customer satisfaction and sales?
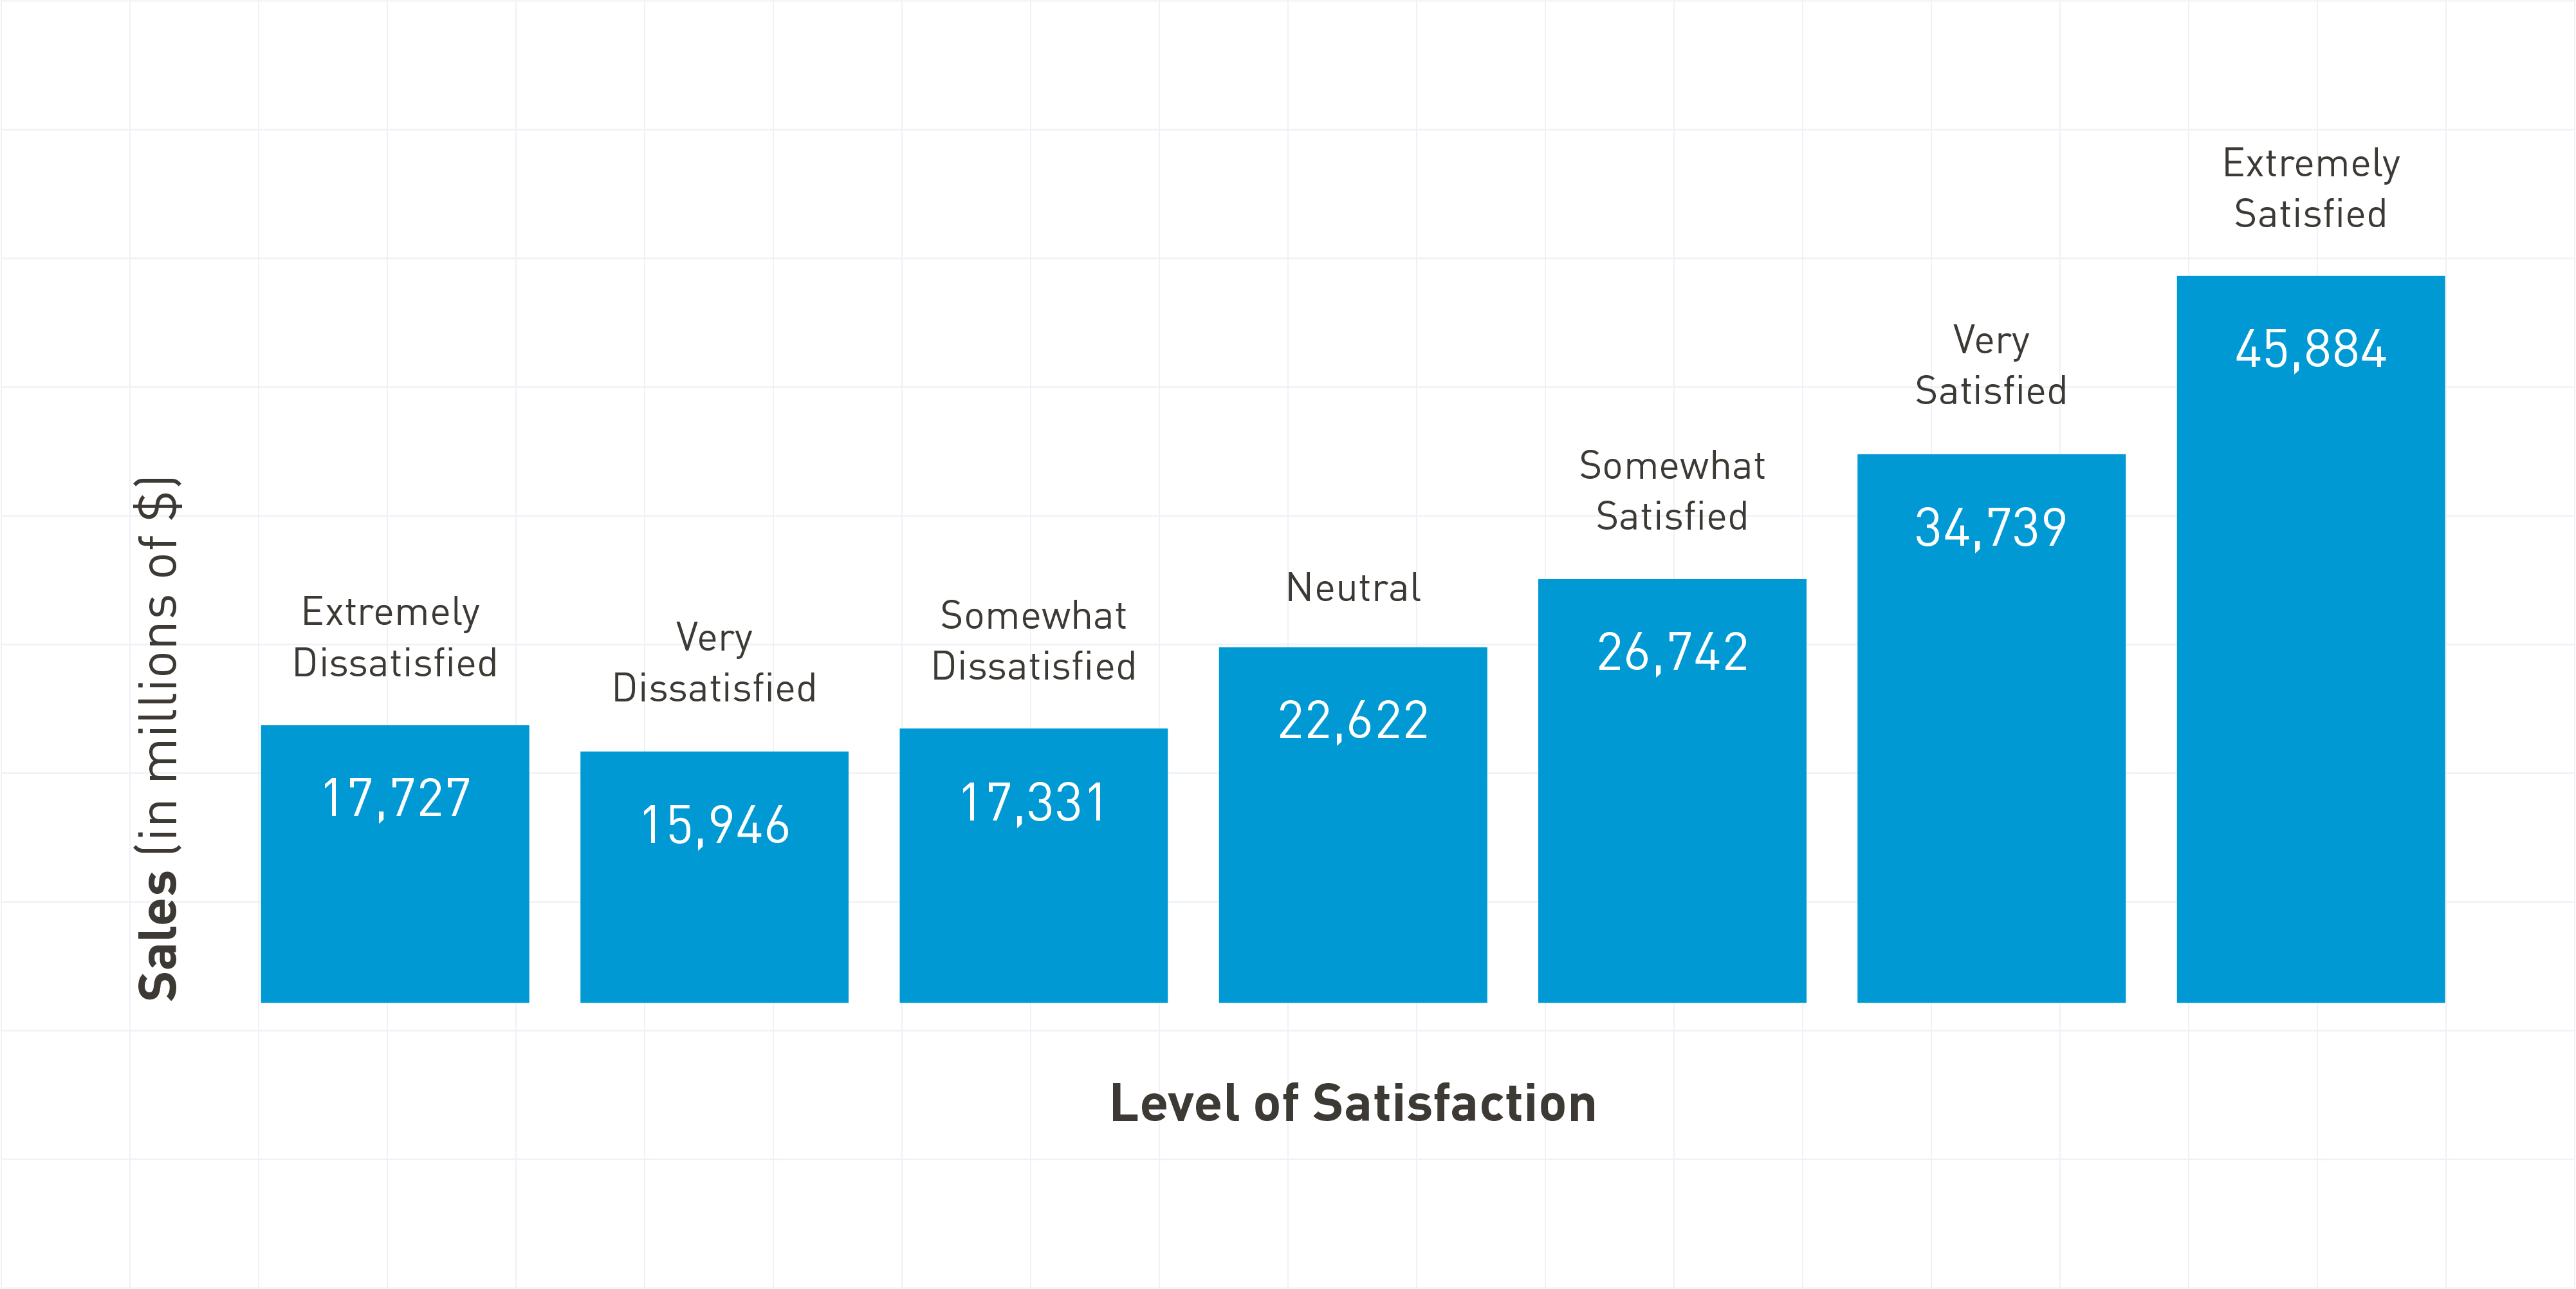
As shown in Figure 1, the relationship between customer satisfaction and sales is asymmetric for satisfaction and dissatisfaction. For the dissatisfaction zone, sales are low and relatively flat. For the average firm in the sample, sales are steady, between $15.9-17.3 billion. Dissatisfied customers are no different than indifferent clients (neither satisfied nor dissatisfied) in terms of sales.
Among satisfied customers, a linear and monotonic increase in sales is observed. When clients go from “somewhat” to “very” to “extremely” satisfied, sales clearly increase, almost exponentially. For the average firm in the sample, sales jump from $26.7 billion to $45.9 billion when clients go from “somewhat satisfied” to “extremely satisfied.”
Figure 1. Customer Satisfaction and Sales Among B2B Clients

3. How does overall customer satisfaction help a B2B firm?
CEOs are accountable for financial results—sales, margins, and firm value. CUBES® shows—boosting overall customer satisfaction can boost sales.
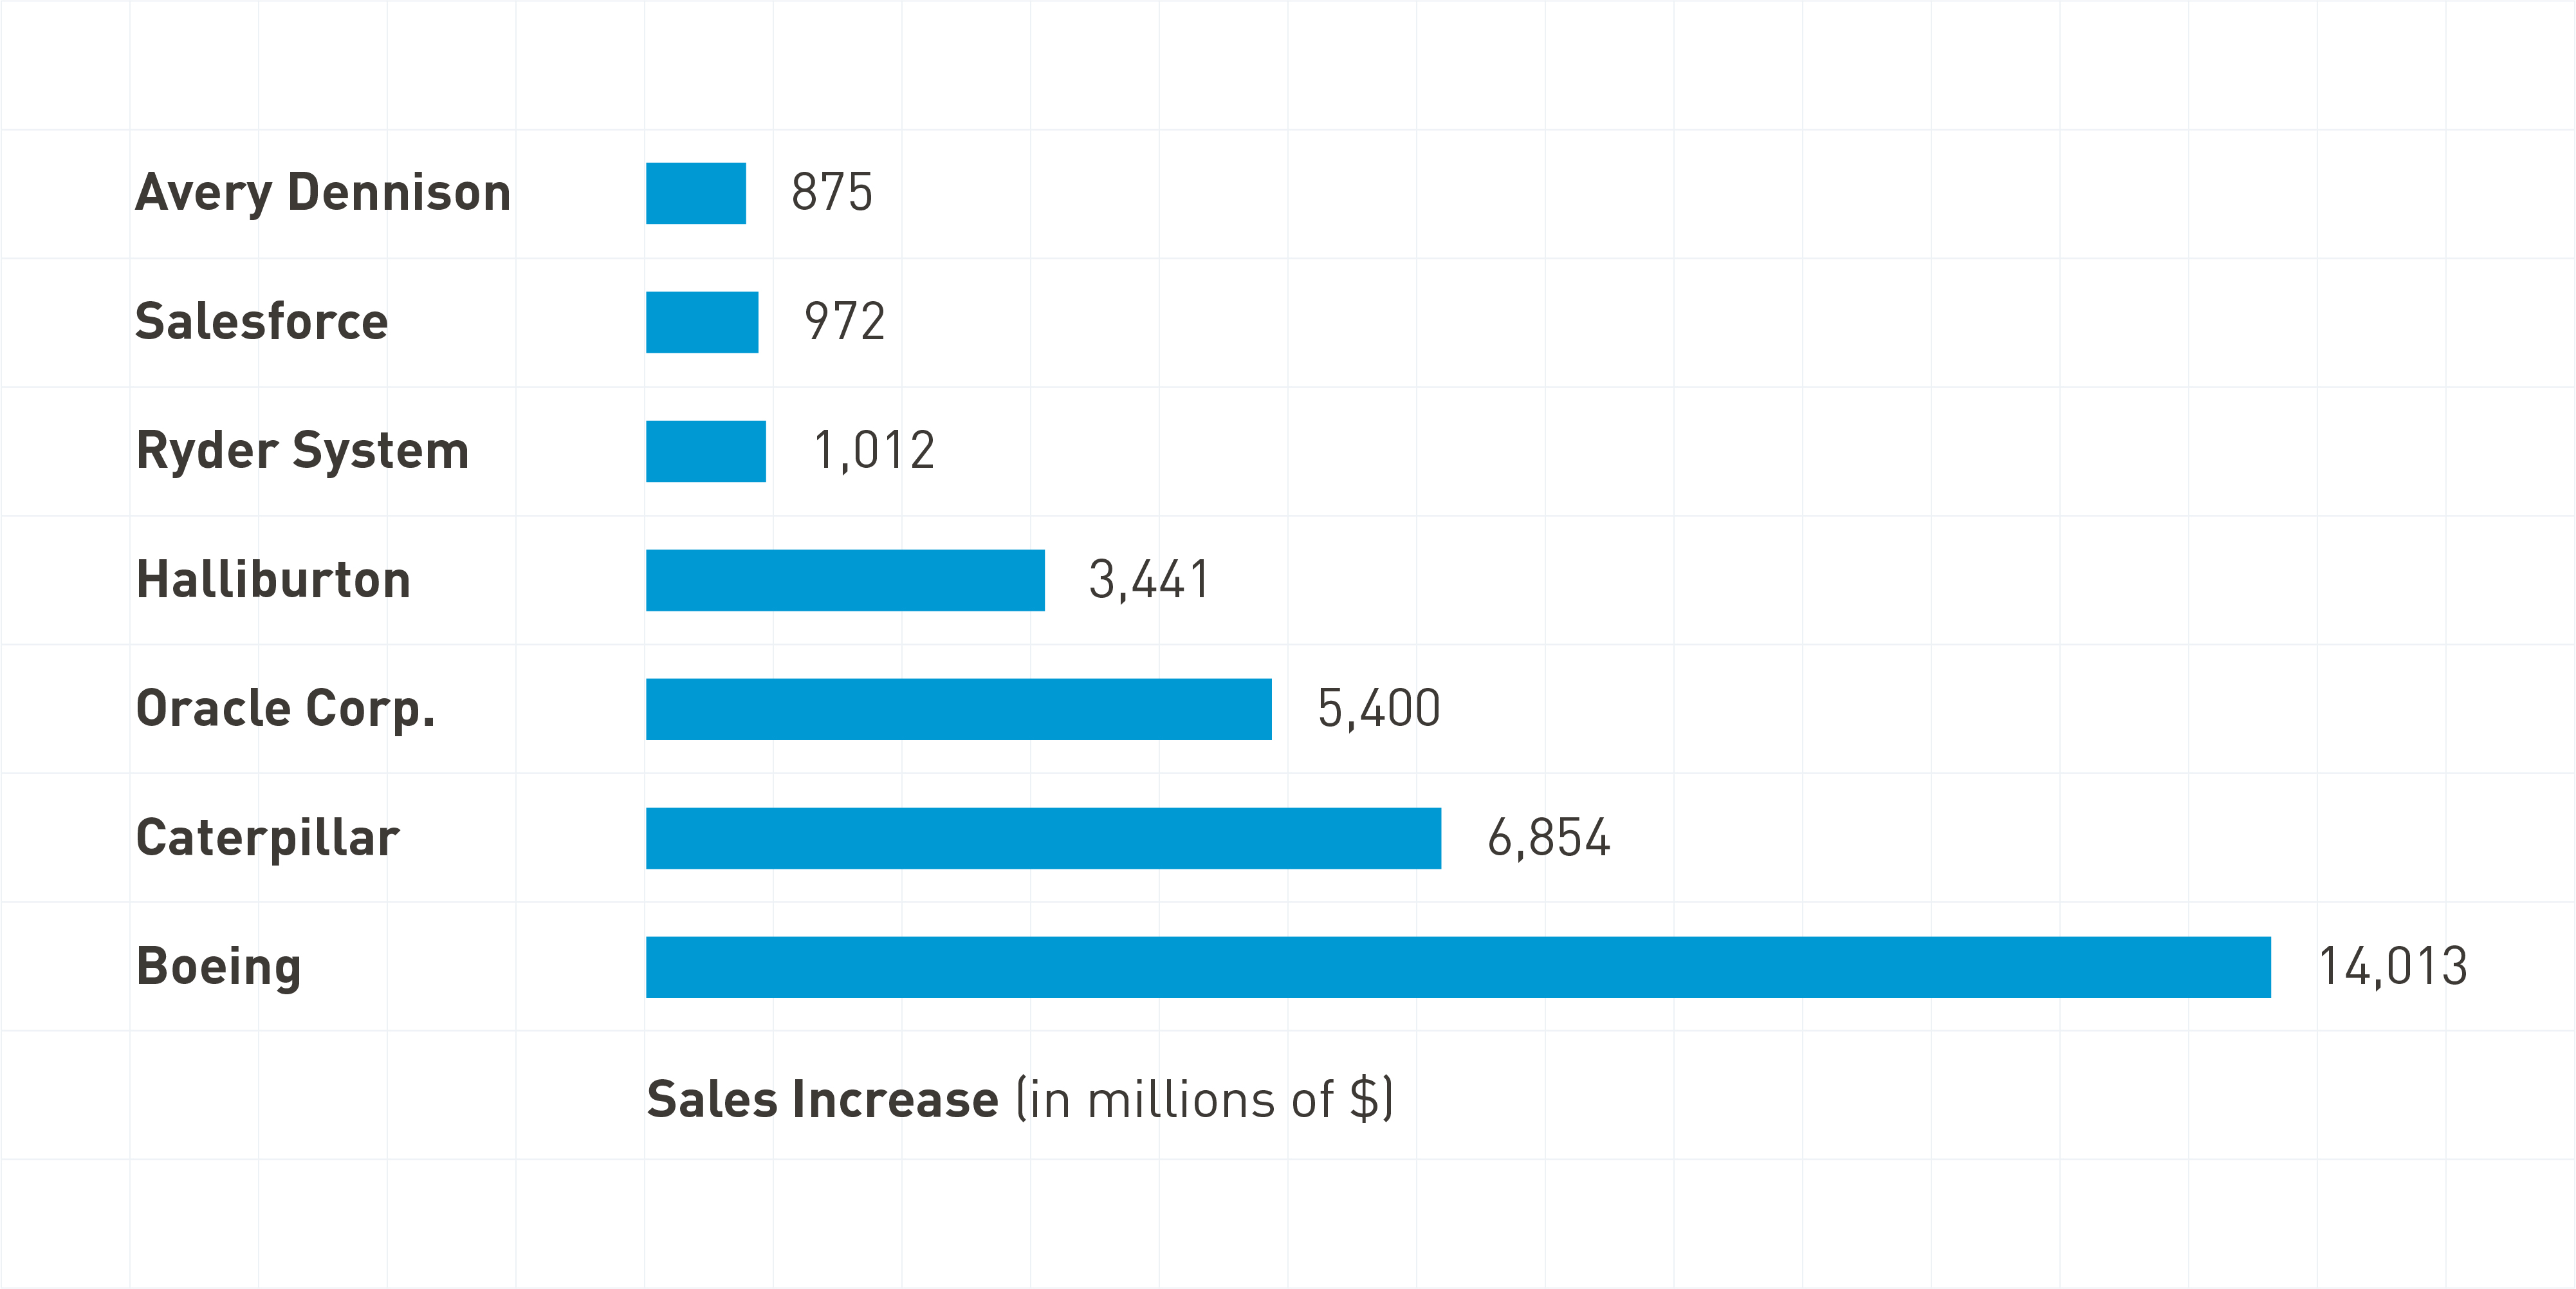
CUBES® calculated the increase in sales for several prominent B2B companies when the customers determined to be “very satisfied” were converted to “extremely satisfied.” For Boeing, the increase in sales amounts to $14.01 billion. Ryder System would increase sales by $1.01 billion. Figure 2 shows the results for Boeing, Ryder and five others.
Figure 2. Sales Increase When Customers Move From “Very” to “Extremely” Satisfied
What’s Next?
One of the biggest concerns for every B2B firm is growing sales. But rather than fall into the value trap of adding features and lowering price, B2B companies should focus on managing overall customer satisfaction to grow sales.


